Tutorial
How to Use the Xmaster Formula Indicator for Effective Forex Trading
How to Use the Xmaster Formula Indicator for Effective Forex Trading
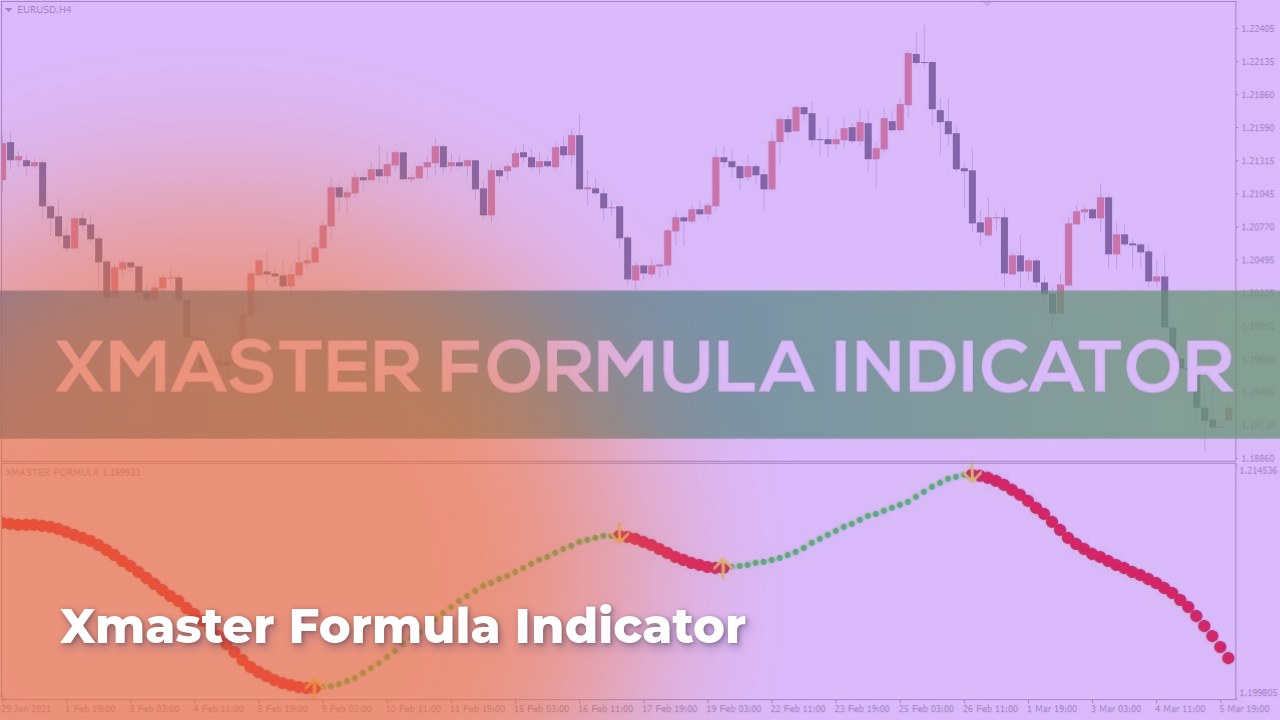
The Xmaster Formula Indicator has quickly become a trusted ally for traders navigating the dynamic world of Forex. This innovative tool is designed to optimize trading strategies, providing clear signals and insights that can make the trading experience more fruitful. By combining the analytical power of this indicator with sound trading techniques, both novice and seasoned traders can enhance their decision-making processes and potentially increase their profitability.
In a market characterized by uncertainty and rapid fluctuations, the Xmaster Formula Indicator stands out for its user-friendly interface and robust analytical capabilities. It simplifies the complex landscape of trading, allowing users to digest critical information at a glance and react decisively. With its effective trend identification and signal generation capabilities, the indicator serves as a vital resource for anyone looking to make informed trading decisions.
Understanding the Xmaster Formula Indicator
The Xmaster Formula Indicator is a sophisticated technical analysis tool designed to help traders identify trends and make informed decisions based on market analysis. By combining multiple indicators, such as the Relative Strength Index (RSI) and Moving Average Convergence Divergence (MACD), it provides traders with a well-rounded perspective on market conditions. This holistic approach helps traders capitalize on trends and potential reversals, offering clarity in a fast-paced environment.
What is the Xmaster Formula Indicator?
The Xmaster Formula Indicator serves as a guiding light for Forex traders, illuminating the often murky waters of price movement with its advanced algorithms. By analyzing various market factors including price action, volume, and momentum it generates visually intuitive signals that indicate potential trading opportunities.
The two primary components of the Xmaster Formula are:
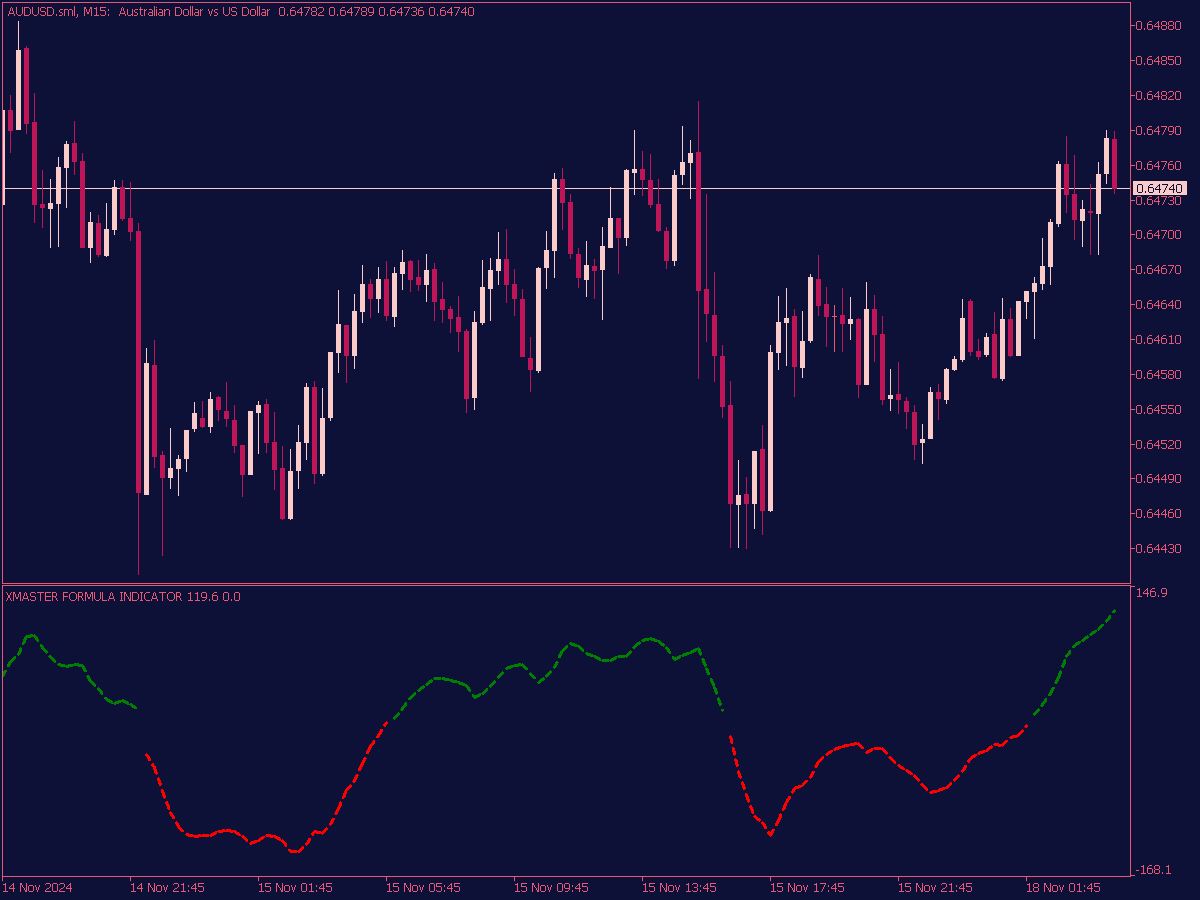
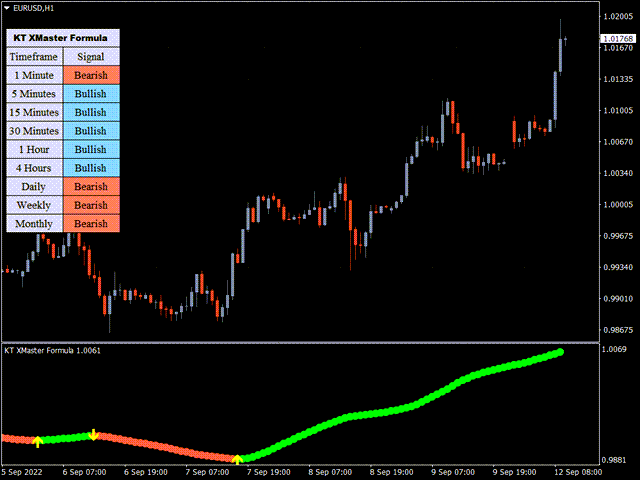
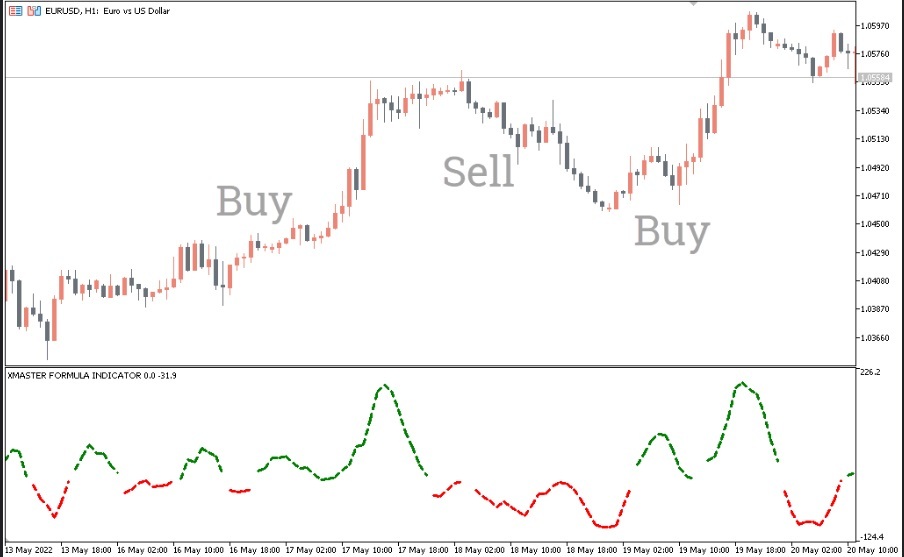
- Visual Signals: The indicator uses colored lines to denote buy (green) and sell (red) opportunities. These immediate visual cues help traders react quickly to market changes.
- Stability and Reliability: Unlike many other indicators, the Xmaster Formula does not repaint, meaning its signals remain stable and are not altered post-analysis. This aspect enhances traders’ confidence in the signals provided, knowing that historical data remains unchanged.
| Feature | Details |
|---|---|
| \*\*Market\*\* | Primarily Forex, but also adaptable to stocks and commodities |
| \*\*Components\*\* | Integrates RSI and MACD for comprehensive analysis |
| \*\*Visual Representation\*\* | Color-coded signals (green for buy, red for sell) |
| \*\*Repainting\*\* | Does not repaint, ensuring reliability |
How Does the Xmaster Formula Indicator Work?
At its core, the Xmaster Formula Indicator is designed for simplicity without sacrificing depth. It operates through an intricate algorithm that takes multiple technical indicators and combines their outputs into a singular, cohesive signal. This means that traders do not need to juggle various indicators; instead, they can rely on one tool to give them an informed overview of market conditions.
The mechanics behind the indicator can be compared to an orchestra where each instrument contributes to a harmonious symphony. In this case, the RSI measures momentum, while the MACD identifies trend direction and strength. Together, they create a clearer picture of market dynamics.
To break it down further, here are key operational characteristics:
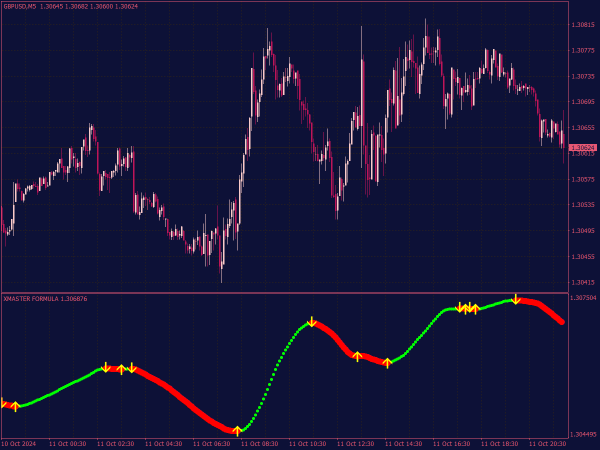
- Color Changes: The indicator’s lines change color based on market conditions. A shift from red to green suggests a build-up in buying momentum, while a red shift indicates selling pressure.
- Timeframe Agility: It is adaptable across various timeframes from minutes to daily charts allowing traders to select their preferred style.
| Operational Aspect | Functionality |
|---|---|
| \*\*Color Indication\*\* | Shifts in color signal potential buy/sell opportunities |
| \*\*Timeframe Flexibility\*\* | Compatible with various charts |
| \*\*Data Analysis\*\* | Integrates multiple signals into one visual output |

Key Components of the Xmaster Formula Indicator
The effectiveness of the Xmaster Formula Indicator can be attributed to its robust key components that enhance trading performance through comprehensive analysis.
1. Integration of Key Indicators: At the heart of the Xmaster Formula are vital technical indicators such as the RSI and MACD. The RSI offers insights into momentum by comparing current price levels with historical data. This is crucial for identifying overbought (above 70) and oversold (below 30) conditions, which can indicate reversal points. Meanwhile, MACD provides deeper insights into trend direction by examining the relationship between two moving averages, enhancing the ability to spot shifts in market momentum.
2. Visual Signals: The color-coded indicators are not merely aesthetic; they facilitate quick comprehension of market status, allowing traders to respond rapidly to fluctuations. This intuitive design eliminates the need for complex calculations during trading sessions.
3. Customizability: Traders can adjust the indicator’s parameters to suit their personal style, whether they prefer scalping quick trades or holding longer positions. This flexibility improves effectiveness across various trading environments.
4. User-Friendliness: Designed to be intuitive, even novice traders can benefit from the Xmaster Formula. Its compatibility with popular trading platforms like MetaTrader 4 and 5 ensures a smooth learning curve.
| Component | Description |
|---|---|
| \*\*RSI Integration\*\* | Analyzes momentum and identifies market extremes |
| \*\*MACD Functionality\*\* | Provides insight into momentum shifts |
| \*\*Customizability\*\* | Adaptable settings for personal trading styles |
| \*\*User-Friendly Interface\*\* | Simplifies the trading process for all levels |

Identifying Trend Reversals with the Xmaster Formula Indicator
Understanding the Xmaster Formula Indicator is vital for recognizing trend reversals. Traders can learn to interpret the signals and adjust their strategies based on market dynamics.

Recognizing Buy Signals
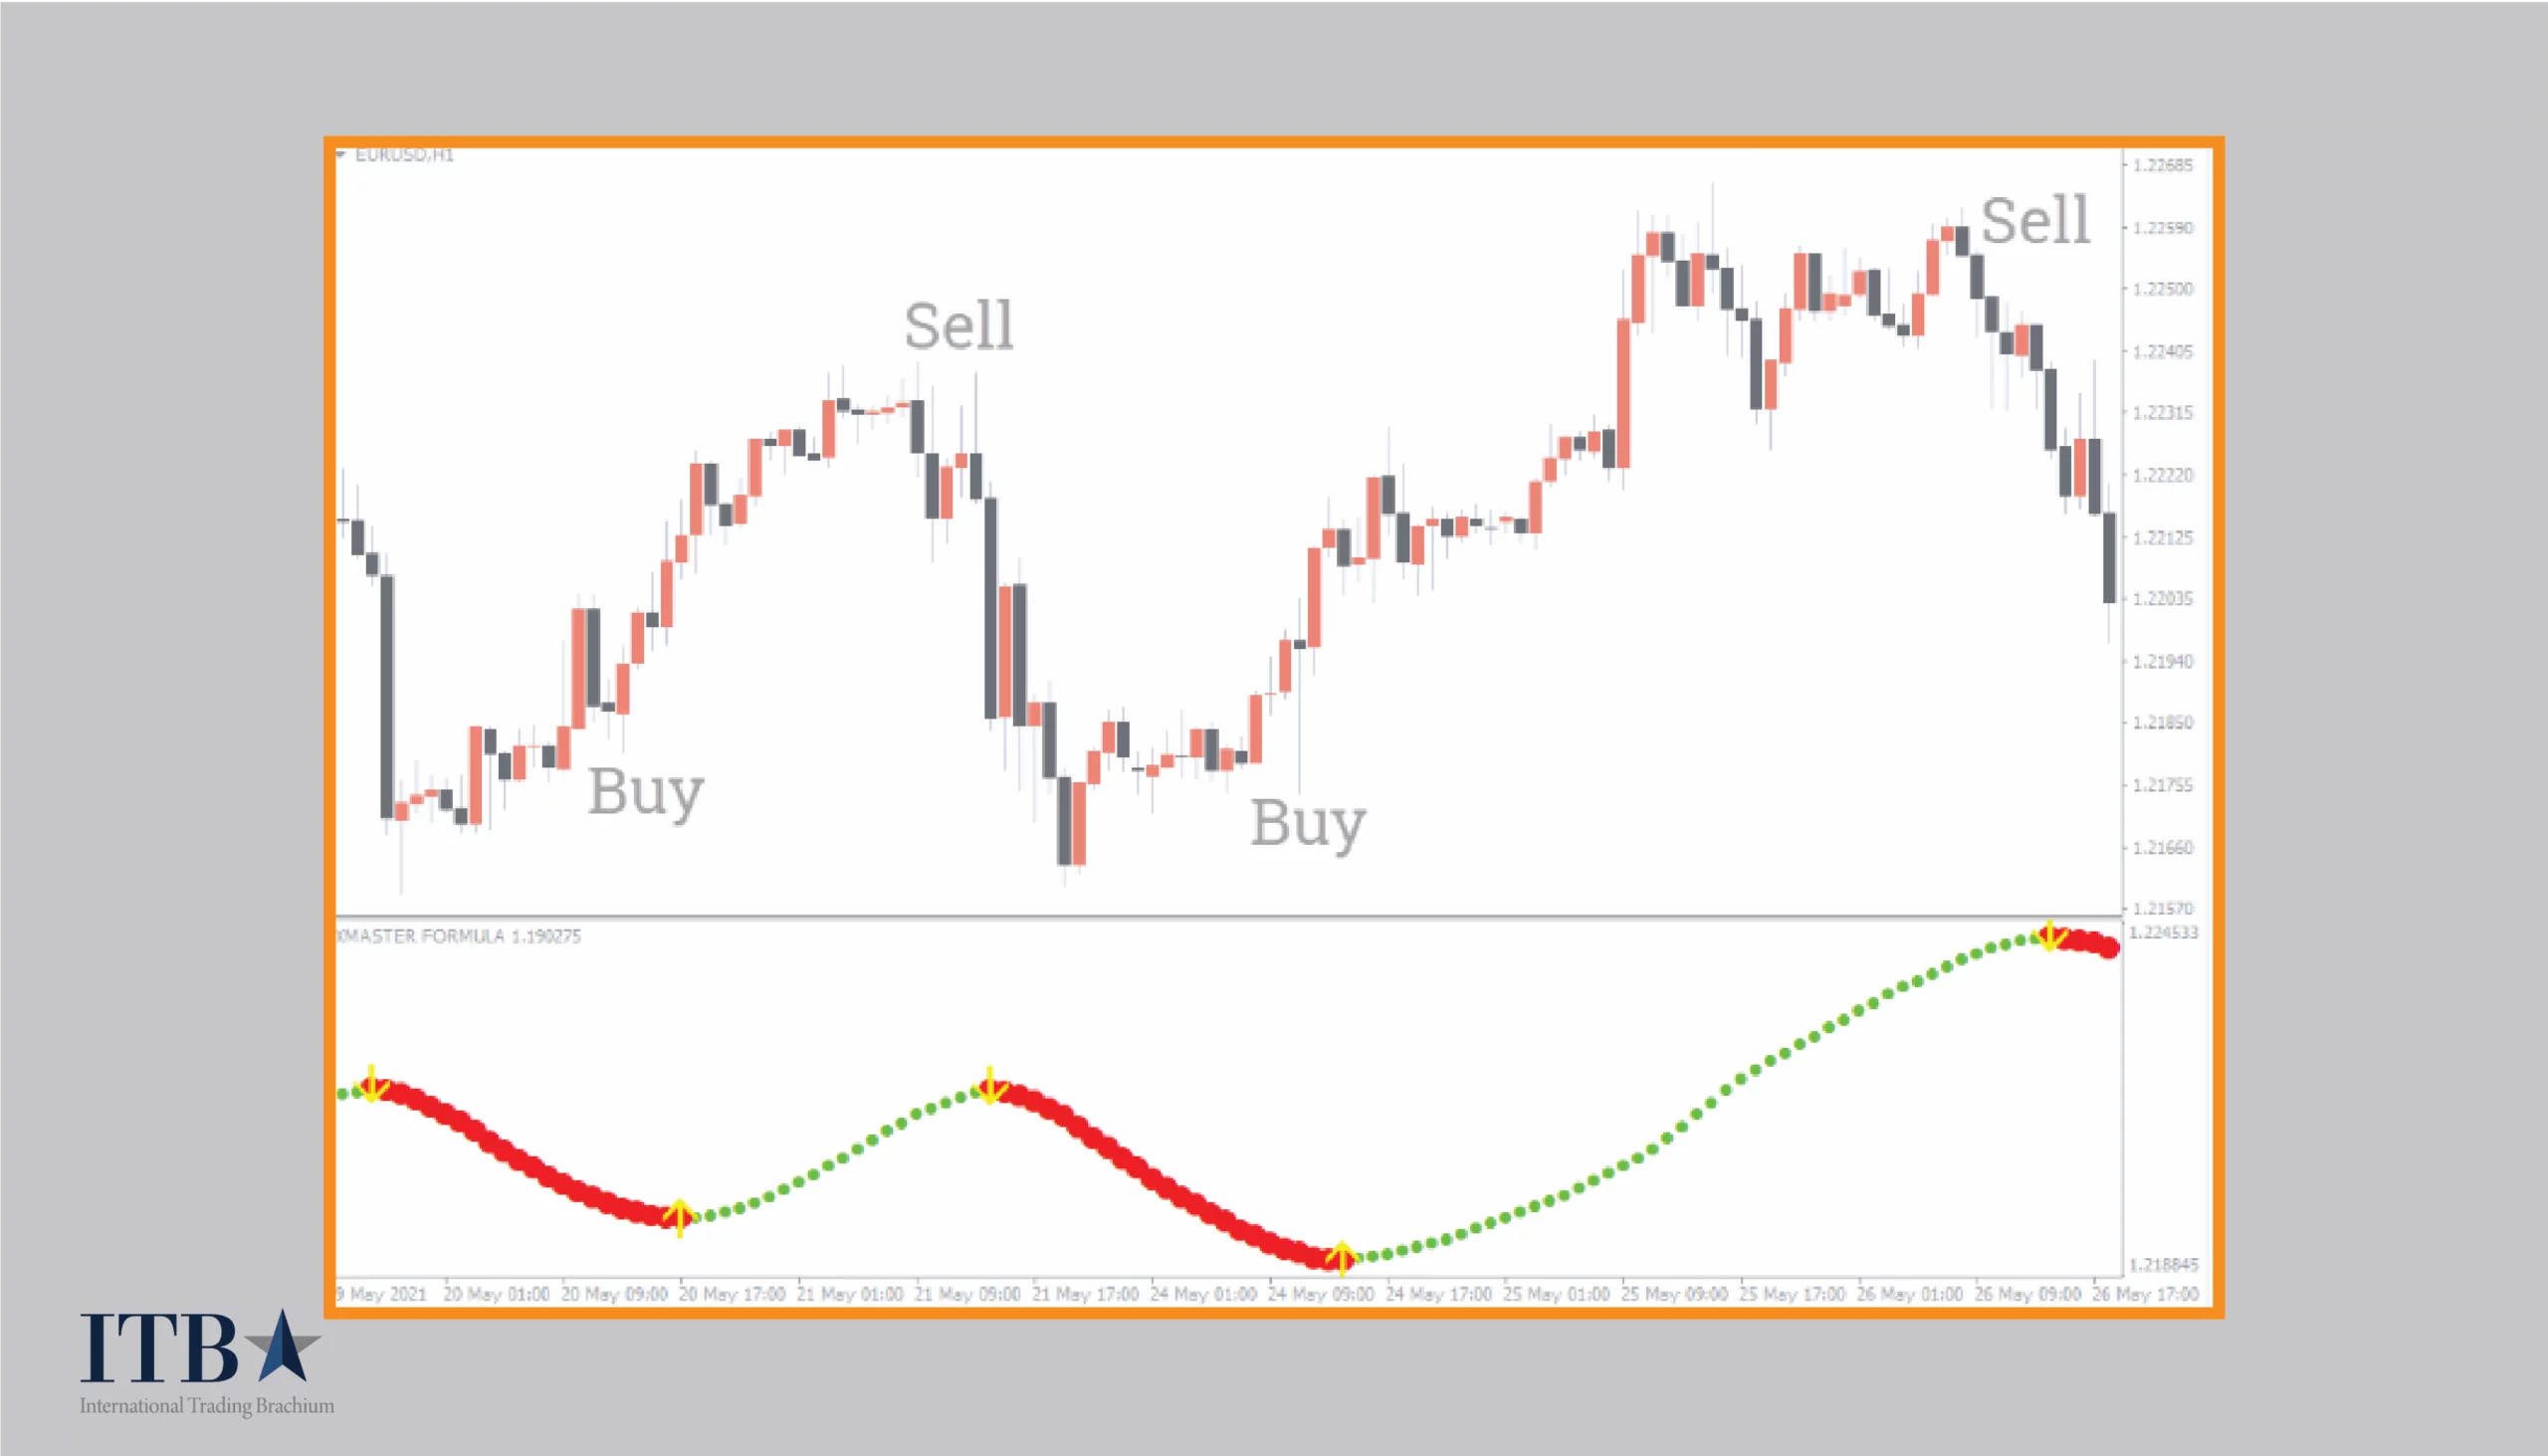
When utilizing the Xmaster Formula Indicator, recognizing buy signals is a crucial aspect of successful trading. A typical buy signal occurs when the indicator changes from red to green. This transition represents a pivotal point where the market sentiment shifts from bearish to bullish. For example, a trader might observe a scenario where a prolonged downtrend starts to show signs of reversal; the first indication would be the red line turning green on the indicator, suggesting a buying opportunity.
Additionally, traders can enhance the reliability of these signals by looking for confirmations. A supportive condition might be the integration of the Silver Trend Signal Indicator providing a corresponding green arrow that aligns with the buy signal from the Xmaster Formula. The presence of these reinforcing signals can significantly enhance the confidence in a potential upward movement.
| Signal Type | Characteristics |
|---|---|
| \*\*Color Change\*\* | Transition from red to green indicates buy |
| \*\*Additional Confirmation\*\* | Green arrows from auxiliary indicators |
| \*\*Market Context\*\* | Look for breakouts above resistance levels |
Another essential tactic involves setting prudent stop-loss orders just below any recent swing low to manage risk effectively. This reflects a disciplined approach to trading and demonstrates the use of the Xmaster Formula as a functional signal provider rather than a sole decision-making tool.
Recognizing Sell Signals
The Xmaster Formula Indicator is equally effective in identifying sell signals, which are vital for capturing potential profit during downtrends. Recognizing these signals helps traders capitalize on bearish sentiment and correctly execute their trades. A typical sell signal arises when the indicator shifts from green to red, suggesting a loss of upward momentum. For instance, a trader might notice that after a sustained uptrend, the red signal emerges, highlighting the potential for value deterioration.
In conjunction with the initial signal, traders often utilize the Silver Trend Signal Indicator to reinforce their trade decisions. For instance, a red arrow appearing from this secondary indicator bolsters confidence in the sell signal generated by the Xmaster Formula. The alignment of these signals suggests a solid confirmation of market conditions, creating an optimal environment for effective bearish trading.
| Signal Type | Characteristics |
|---|---|
| \*\*Color Change\*\* | Transition from green to red indicates sell |
| \*\*Additional Confirmation\*\* | Red arrows from auxiliary indicators |
| \*\*Market Context\*\* | Monitor significant levels like resistance |
Implementing effective stop-loss strategies ensures that risk is managed. Setting stop-loss orders just above recent swing highs allows traders to protect their capital while simultaneously allowing for market fluctuations. Thus, the combined use of the Xmaster Formula Indicator and sound risk management principles creates a winning trading strategy.
Confirming Signals with Other Indicators
In the world of Forex trading, confirmation of signals is paramount to enhance trading accuracy and reduce the risk of false signals. The Xmaster Formula Indicator shines in this regard, as it can seamlessly integrate with other technical analysis tools to bolster a trader’s decision-making process.
1. Supplementary Indicators: Pairs like the Moving Average Convergence Divergence (MACD) or the Relative Strength Index (RSI) serve as effective confirmation tools. For instance, when the Xmaster Formula signals a buying opportunity, a trader may check if the MACD shows a bullish crossover concurrently. This dual confirmation elevates the confidence level considerably, essentially creating a safety net.
2. Trend Indicators: Utilizing trend indicators, such as the Average Directional Index (ADX), further solidifies trading decisions. If the Xmaster Formula indicates a buy and the ADX suggests strong momentum, the trader can confidently ride the upward wave.
Here’s how some combinatory strategies work:
| Strategy | Tool Used | Benefit |
|---|---|---|
| \*\*MACD Confirmation\*\* | MACD | Validates bullish/bearish momentum changes |
| \*\*RSI Overbought/Oversold Levels\*\* | RSI | Confirms potential reversal points |
| \*\*ADX Trend Strength Monitor\*\* | ADX | Assists in identifying strong directional moves |
By systematically incorporating additional indicators, traders can significantly enhance the reliability of the Xmaster Formula’s signals, creating a more comprehensive trading strategy.
Optimizing the Xmaster Formula Indicator for Your Trading Strategy
Identifying trend reversals using the Xmaster Formula Indicator is just the tip of the iceberg. It is equally vital to optimize the indicator for individual trading strategies, ensuring consistent profitability. This next step prepares traders to effectively adapt their trading practices based on their unique styles and market conditions.
Choosing the Right Timeframe
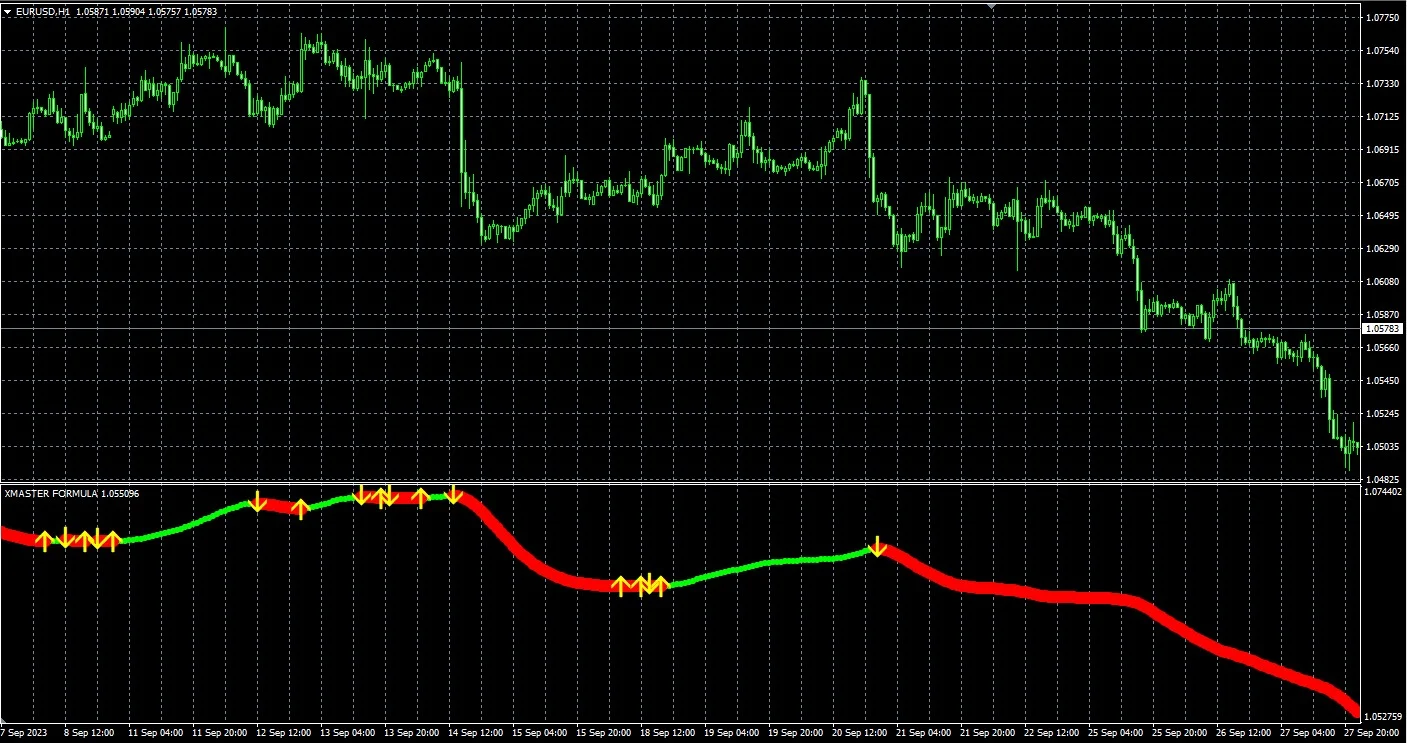
Selecting the right timeframe is a cornerstone of effective trading with the Xmaster Formula Indicator. The indicator’s versatility enables it to operate efficiently across multiple timeframes from minute-based charts to daily views, allowing traders to customize based on their trading strategy.
For instance, traders focused on scalping might prefer shorter timeframes such as 5 or 15 minutes, where they can execute trades rapidly to take advantage of minor price fluctuations. However, shorter timeframes can be susceptible to market noise, and traders must be prepared for increased volatility.
Conversely, swing traders who hold positions over several hours or days may benefit from longer timeframes, like 1-hour or 4-hour charts. These timeframes generally provide more reliable signals, filtering out minor fluctuations and offering a clearer trend perspective.
| Trading Style | Recommended Timeframes | Advantages |
|---|---|---|
| \*\*Scalping\*\* | 5 or 15 minutes | Quick execution of trades |
| \*\*Swing Trading\*\* | 1-hour, 4-hour | More reliable signal analysis |
| \*\*Position Trading\*\* | Daily, Weekly | Long-term market visibility |
In conclusion, assessing trading goals and personal styles ultimately determines which timeframe serves best. Through diligent market observation, traders can refine their strategies by understanding how the Xmaster Formula behaves across different timeframes.
Adjusting Indicator Settings
To fully harness the power of the Xmaster Formula Indicator, traders should explore adjusting its settings to align with their unique strategies and goals. The ability to customize parameters is incredibly beneficial for optimizing trading outcomes.
1. Sensitivity Adjustments: One of the first considerations when adjusting indicator settings involves the sensitivity of the signals. For instance, traders can modify the length of moving averages within the Xmaster Formula, thus impacting the frequency of buy or sell indications. A shorter length tends to produce more signals but might lead to false positives; conversely, a longer length yields fewer, but more accurate, signals.
2. Market Phases: It’s also essential to tailor settings based on the current market phase. During highly volatile periods, traders may wish to adopt settings that provide fewer signals to mitigate unnecessary exposure, while in trending markets, adjusting for more frequent signals might be advantageous.
| Adjustments | Impact on Trading |
|---|---|
| \*\*Signal Sensitivity\*\* | Frequency of signals |
| \*\*Market Context\*\* | Tailoring based on conditions |
| \*\*Timeframe Adaptation\*\* | Adjusting for noise |
Through continuous backtesting and experimentation, traders can identify the settings that produce optimal results in varying market conditions. Regularly reviewing and refining these settings ensures that the Xmaster Formula Indicator remains a powerful ally in their trading toolkit.

Combining with Other Technical Analysis Tools
Enhancing the effectiveness of the Xmaster Formula Indicator becomes even more impactful when traders combine it with other robust technical analysis tools. This integration creates a multipronged strategy that can deliver richer insights and more reliable trading signals.
1. Support and Resistance Levels: By implementing support and resistance analysis, traders can use the Xmaster Formula signals more effectively. If a buy signal occurs at a confirmed support level, it enhances the probability of a successful long position, while a sell signal at resistance suggests caution.
2. Market Sentiment Indicators: Tools like the Currency Strength Meter can help traders assess the overall strength of currencies in the market and identify favorable trading pairs, complementing Xmaster Formula signals.
| Tool Combination | Benefits |
|---|---|
| \*\*Support/Resistance Levels\*\* | Identifies strong entry/exit points |
| \*\*Currency Strength Meter\*\* | Aids in selecting pairs |
| \*\*Trend Indicators\*\* | Validates momentum directions |
In addition to these combinations, incorporating chart patterns could also enhance strategy effectiveness. By recognizing formations such as triangles or head-and-shoulders alongside the buy/sell signals, traders can gain an edge in understanding future price movements.
Through this integration of the Xmaster Formula with other analytical tools, traders can enhance their strategies and achieve greater consistency in their trading outcomes.

Managing Risk with the Xmaster Formula Indicator
For traders aiming to harness the power of the Xmaster Formula Indicator, managing risk effectively is a vital part of the equation. By implementing sound risk management strategies, including setting appropriate stop-loss and take-profit orders, traders can navigate the complexities of Forex trading with greater confidence.
Setting Stop-Loss and Take-Profit Orders
Establishing clear stop-loss and take-profit orders is essential for managing risk while trading with the Xmaster Formula Indicator. These tools help protect capital by determining exit points for trades based on predefined risk levels.
1. Stop-Loss Orders: For buy trades, a prudent approach would be to set the stop-loss order just below the recent swing low or below the lowest point of the signal candle. This placement ensures that the trade has enough room to breathe while still safeguarding against substantial losses.
2. Take-Profit Orders: Conversely, take-profit levels should ideally be positioned at significant resistance levels to secure potential gains. A common guideline is to aim for a risk-reward ratio, such as 1:2; for example, if the stop-loss is set at 30 pips, the take-profit can be realistically set at 60 pips.
| Order Type | Placement Strategy |
|---|---|
| \*\*Stop-Loss\*\* | Below recent swing lows for buy trades |
| \*\*Take-Profit\*\* | At resistance or using a risk-reward ratio |
Incorporate these orders as part of the overall trading strategy to maintain a disciplined approach while trading. This practice not only protects capital but also enhances the self-control required for successful trading.
Using Position Sizing Techniques
Position sizing is another crucial element of risk management that traders cannot afford to overlook. By determining the appropriate amount of capital to allocate to each trade, traders can minimize the impact of losses and maximize overall profitability.
1. Fixed Fractional Method: A popular technique is to use a fixed fractional method where a specific percentage of the trading account (e.g., 1-2%) is risked on each trade. This practice ensures that no single trade can significantly deplete the trader’s capital.
2. Volatility-Based Sizing: Another effective method is to adjust position sizes based on the asset’s volatility. For instance, trading a more volatile pair might warrant a smaller position size to mitigate the risk associated with sudden price swings, while a less volatile pair may allow for a larger position.
| Method | Description |
|---|---|
| \*\*Fixed Fractional\*\* | Risk a consistent percentage of account balance |
| \*\*Volatility-Based Sizing\*\* | Adjust position sizes according to market volatility |
By implementing sound position sizing techniques, traders can better manage overall exposure in the market, allowing for a more sustainable trading practice.
Avoiding Common Pitfalls
When trading with the Xmaster Formula Indicator, avoiding common pitfalls is essential for achieving long-term success. Many traders fall into traps that can result in significant losses or missed opportunities.
1. Overtrading: One prevalent pitfall is overtrading taking excessive positions due to the availability of signals. This practice can lead to emotional strain and can significantly diminish the effectiveness of the overall trading strategy. Instead, traders should focus on quality over quantity, selecting only the most promising signals.
2. Ignoring Market Context: Traders must be cautious of ignoring overall market conditions while solely relying on the signals from the indicator. Understanding broader economic events and how they might impact currency pairs can provide crucial context that helps refine trading decisions.
3. Lack of Backtesting: Failing to backtest strategies using the Xmaster Formula Indicator can lead to reliance on poorly-suited settings. Backtesting against historical data is vital for identifying strengths and weaknesses in the strategy.
| Common Pitfall | Consequence |
|---|---|
| \*\*Overtrading\*\* | Emotional strain and unmanageable losses |
| \*\*Ignoring Market Context\*\* | Misjudgment of market movements |
| \*\*Lack of Backtesting\*\* | Ineffective settings and untested strategies |
By remaining vigilant of these common issues and proactively working to avoid them, traders can cultivate a healthier approach to trading with the Xmaster Formula Indicator.
Backtesting the Xmaster Formula Indicator
Effective risk management and strategic planning are only as good as their implementation. Backtesting the Xmaster Formula Indicator remains an essential aspect of honing a trader’s strategies and ensuring their effectiveness in real-time trading.
The Importance of Backtesting
Backtesting refers to the process of assessing how well a trading strategy would have performed based on historical data. This practice holds significant importance for traders utilizing the Xmaster Formula Indicator, as it allows them to gauge the potential success of their approaches before risking real capital.
Backtesting provides valuable insights into:
1. Strategy Validation: By applying the Xmaster Formula Indicator to historical price movements, traders can identify whether specific signals would have resulted in profitable trades or losses.
2. Performance Metrics: Traders can analyze crucial performance metrics, such as win/loss ratio, profit factor, and maximum drawdown, which help evaluate the robustness of a trading strategy.
In essence, backtesting helps traders build confidence in their strategies and supports informed decision-making in live trading environments.
| Benefits of Backtesting | Description |
|---|---|
| \*\*Validation\*\* | Confirms the effectiveness of trading strategies |
| \*\*Performance Analysis\*\* | Provides critical performance insights |
By leveraging the insights gained from backtesting, traders can fine-tune their strategies and maximize their chances for success in real-time trading scenarios.
Steps to Backtest the Xmaster Formula Indicator
To perform an effective backtest using the Xmaster Formula Indicator, traders should follow a series of structured steps.
1. Indicator Installation: Begin by downloading the Xmaster Formula Indicator from a reliable source, and install it on the MetaTrader 4 or 5 trading platform.
2. Historical Data Selection: Choose the currency pairs and timeframes for the backtest, ensuring a comprehensive evaluation over various market conditions (bullish, bearish, and sideways).
3. Strategy Testing Setup: Access the Strategy Tester tool in your trading platform and load the historical data you’ve selected.
4. Parameters Setup: Configure the settings of the Xmaster Formula Indicator within the Strategy Tester to align with your trading strategy.
5. Execute Backtest: Run the backtest and observe the Xmaster Formula’s performance based on your set parameters and historical data.
| Backtesting Steps | Actions |
|---|---|
| \*\*Installation\*\* | Download and install the indicator |
| \*\*Data Selection\*\* | Choose appropriate currency pairs and timeframes |
| \*\*Setup Testing\*\* | Configure the parameters in the Strategy Tester |
| \*\*Execute\*\* | Run the backtest and analyze results |
Analyzing Backtesting Results
Once the backtesting process is completed, analyzing the results comprehensively is the next crucial phase. This examination provides traders with insights into the performance of their strategies.
1. Key Metrics: Traders should focus on essential metrics such as total trades executed, percentage of winning trades, and total profit/loss. These statistics paint a clear picture of the strategy’s effectiveness.
2. Drawdown Analysis: Examining maximum drawdown levels helps traders understand the potential risks involved and sets the stage for refining their risk management practices.
3. Improvement Opportunities: By closely scrutinizing winning and losing trades, traders can identify patterns that may highlight strengths or weaknesses in the strategy, allowing for targeted improvements.
| Result Analysis | Key Metrics |
|---|---|
| \*\*Total Trades\*\* | Provides insights into trading activity |
| \*\*Win/Loss Ratio\*\* | Indicates effectiveness of signals |
| \*\*Maximum Drawdown\*\* | Reflects potential risk exposure |
This approach allows traders to navigate future trading challenges with enhanced strategies built on quantifiable data.

Real-World Applications of the Xmaster Formula Indicator
Taking theory into practice strengthens a trader’s confidence and proficiency with the Xmaster Formula Indicator. Understanding its real-world applications allows traders to see the impact this tool can have on their trading endeavors.

Case Studies of Successful Trades
Examining case studies of successful trades using the Xmaster Formula Indicator can provide valuable lessons and insights. One prominent example involves a forex trader utilizing the indicator during a volatile trading period.
1. Trend Following Trade: The trader identified a strong upward trend in the EUR/USD pair. The Xmaster Formula initially produced a buy signal as indicated by the green line. Pivoting off this signal, the trader confirmed their decision using supplementary indicators, such as the RSI indicating that the asset was not overbought. As a result, the trader entered a position and set a stop-loss order just below the last swing low, thereby effectively managing risk.
2. Reversal Trade: In another instance, the trader noticed a change in momentum when the price of a particular currency pair started leveling out. The Xmaster Formula signaled a possible sell opportunity with its red signal. Concurrently, other indicators echoed this impending market reversal. By taking a short position at this time, the trader managed to seize a profitable moment as market prices dropped.
| Case Study | Outcome |
|---|---|
| \*\*Trend Following\*\* | Successful trade with risk management |
| \*\*Reversal Trade\*\* | Captured downside potential |
These case studies illustrate the versatility of the Xmaster Formula Indicator and how effective it can be when combined with thoughtful analysis and strategies.
Tips for Consistent Profitability
Trading profitability doesn’t hinge solely on the signals from the Xmaster Formula Indicator but rather on a holistic approach that incorporates various strategies for long-term success.
- Adopt Real-Time Alerts: Make use of the real-time alert features in the Xmaster Formula to stay updated and act swiftly on market movements.
- Implement a Combined Strategy: Use the Xmaster Formula alongside other tools for broader market context. For instance, integrating trendlines can help cement your trading decisions based on visual patterns.
- Engage in Regular Backtesting: Continuously test your strategies over historical data to ensure they yield satisfactory results. This practice can prevent reliance on unfounded assumptions.
- Maintain Flexible Adaptation: The Forex market is ever-changing. Traders should monitor conditions regularly and adjust their strategies based on emerging trends and signals.
- Prioritize Risk Management: Successful trading relies heavily on sound risk management practices. Ensure stop-losses are correctly placed, and position sizing is considerate of risks.
By incorporating these tips, traders can optimize the functionality of the Xmaster Formula Indicator and create pathways toward consistent profitability.

Adapting to Changing Market Conditions
The ability to adapt to shifting market conditions is vital for any trader, and utilizing the Xmaster Formula Indicator can greatly assist in this regard. Markets are influenced by various factors, including economic news, geopolitical events, and changes in market sentiment, necessitating fluid trading strategies.
1. Stay Informed: Traders must remain updated on influential economic releases and central bank decisions. These events can shift market sentiment rapidly, prompting traders to reconsider their positions based on Xmaster signals generated during such periods.
2. Assess Overall Market Sentiment: Gauging broader market sentiment such as whether the market is risk-on or risk-off can help traders to adjust their strategies effectively. For example, in risk-off environments, a trader might become more cautious and rely more on the Xmaster Formula sell signals.
3. Dynamic Position Management: As conditions evolve, traders should reconsider their stop-loss and take-profit levels. A volatile market may necessitate wider stop-loss orders, while stable market conditions could enable tighter stops.
| Adaptation Strategy | Actions to Take |
|---|---|
| \*\*Stay Updated\*\* | Monitor economic news and market sentiment |
| \*\*Reassess Positions\*\* | Review stop-loss and take-profit placements |
| \*\*Dynamic Strategy\*\* | Adjust strategies based on changing conditions |
Implementing these strategies allows traders to adapt successfully to market fluctuations, ensuring the Xmaster Formula Indicator remains an effective tool in their trading arsenal.
Conclusion
Navigating the Forex market can be both daunting and exhilarating, but with the Xmaster Formula Indicator in hand, traders unlock a powerful tool designed to simplify their decision-making processes. From understanding how the indicator works to implementing risk management and continuously adapting to market changes, it becomes evident that the Xmaster Formula is not merely about generating signals it’s about fostering a holistic trading approach.
By embracing comprehensive strategies that involve backtesting, risk management, and supplementary tools, traders can leverage the true potential of the Xmaster Formula Indicator. As they cultivate their skills and adapt their behaviors through informed practices, they set the stage for a more confident, profitable trading experience where outcomes are not left to chance but are shaped by perseverance and wisdom.

